
Bar-i Speed Count and Bar-i Complete, the first phase of our new software updates, were released in late 2020 and have been in use with our clients for a while. This month, we’re rolling out the final two tiers of our new software upgrade – Speed Count Pro and Pro Lite.
At Bar-i, we provide the fastest and most accurate counting method available by combining our proprietary software with the use of scales and barcode scanners. But counting inventory fast is only one benefit of our system. We also provide the robust data necessary to ensure that you make counting count.
Many bars spend a lot of time on bar inventory, but in many cases, they aren’t making their efforts count. All too often, inventory becomes an exercise to know what to order and provide information to your bookkeeper, but it’s not being used as a tool to increase your profitability. When you’re able to increase profits from your inventory audits, you’re truly making these efforts count. To do that, you need the robust data and reporting necessary to understand exactly how every product you sell is performing.
Our new pro level products elevate your ability to leverage your inventory efforts as a profitability tool, allowing you to make counting count. The following six items are contained in the new Bar-i inventory reports, but not typically contained in the reports of other inventory service providers.
Servings Rung vs. Poured for Every Product
We count and purchase products in bottles and kegs, but we serve them in drinks. If you don’t have software capable of converting the items being counted into the same measurements as they’re served in, you end up purchasing and counting in units that don’t fit the problem at hand. To really understand what’s happening at your bar, you need to see servings rung vs. servings poured.
Bar-i’s process makes this possible, and our new reports provide you with this information in a format that’s easy to understand.
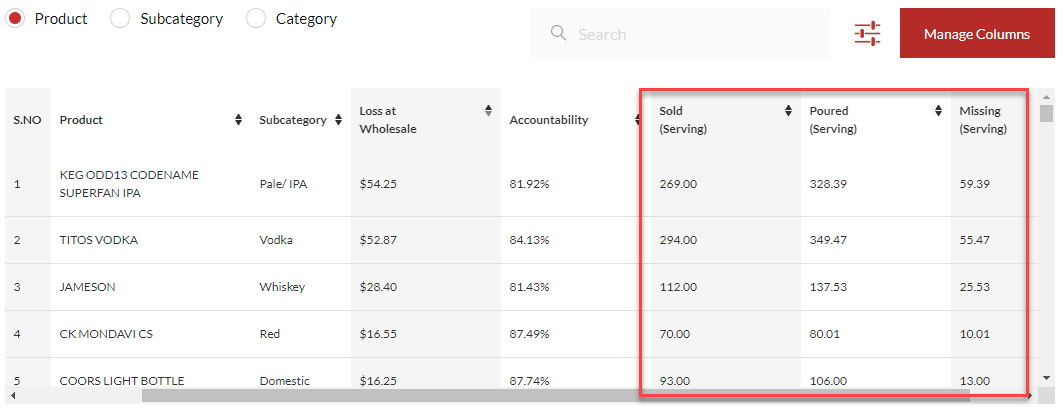
Percentage of Product Poured that Was Actually Sold
If you used 100 bottles of Budweiser in a week, ideally your POS report would show 100 bottles sold. In this situation, you’d have sold 100% of the product you used. In most cases, bars sell between 80-90% of the product used when they first start working with us. In other words, they’re missing 10-20% of everything they pour.
For every single product, we look at how many servings were poured and how many servings were sold. We divide the number sold by the number poured to determine the percentage poured that was actually sold. We call this our accountability score.
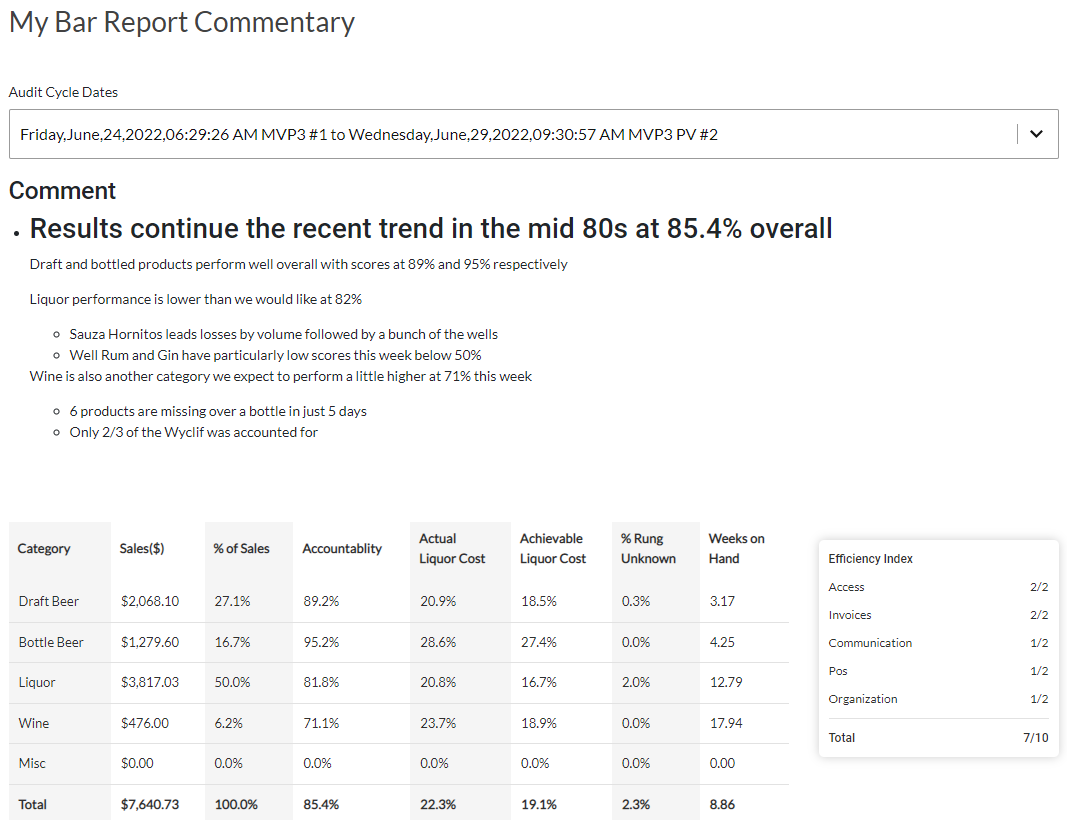
We calculate this accountability score on a product by product basis, but we also calculate it on aggregate by product category and for the entire bar. In the example below, the accountability score for the entire bar is 85.4%, which means approximately 15% of everything poured at the bar isn’t being sold.
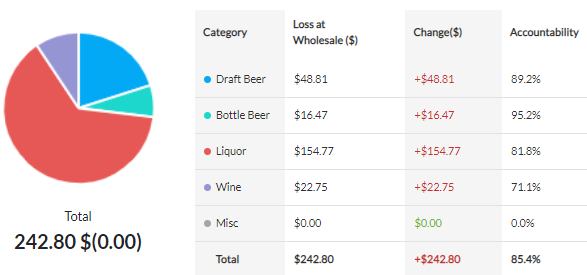
Loss at Wholesale
If you sell 1 shot of Jack Daniels but pour a 2 oz. shot instead of a 1.5 oz. shot, then the 0.5 oz. of alcohol that wasn’t accounted for shows up as a loss at wholesale. In this example, the loss at wholesale would be the cost of half an ounce of Jack Daniels.
We provide loss at wholesale on a product by product basis, by category and for the entire bar. This lets you truly see the impact of missing product on your bar’s profits. Most bar owners know they’re using more alcohol than they sell, but when you see the percentage missing and the cost to your bar, it becomes a powerful tool for understanding the impact on your overall profitability.
It's important to remember that loss at wholesale is the most conservative measurement of this cost on your bottom line. The actual cost to your bar usually falls between this wholesale loss and the retail loss. Bar-i’s reports provide you with the loss at wholesale figure, and this enables us to extrapolate the actual cost to your business.
Having the known figure (loss at wholesale - shown in the image above) is a useful measurement to have as a starting point when determining how much money your missing product is actually costing your bar.
Liquor Cost for Every Button
Liquor cost is a figure that tells you how much you spend purchasing product to generate a dollar in sales. For example, if you sell a shot of Jack Daniels for $5 and it costs you $1, your liquor cost is 20%. In other words, for every dollar in sales generated, it cost you 20 cents in product.
Most bars will calculate liquor cost in aggregate – either by category or for the entire bar. What’s often missing in these aggregate calculations is the ability to see your liquor cost for each individual product. This more granular data is an effective tool that will help you set your pricing more accurately.
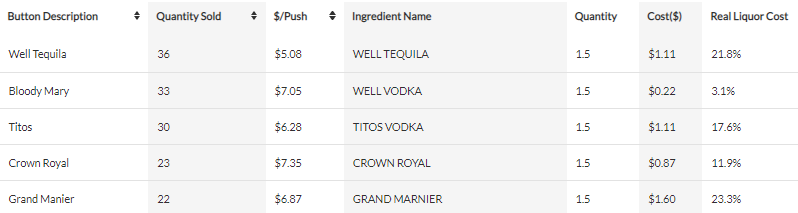
It’s also useful to get even more detailed and calculate your liquor cost fore every button on your POS system. This will show you how the liquor cost of a specific product varies by the drink it’s being poured in.
Every Bar-i inventory report contains a breakdown of liquor cost by button, giving you the most granular information possible. This ensures you’re able to gain the most complete picture of your bar’s performance.
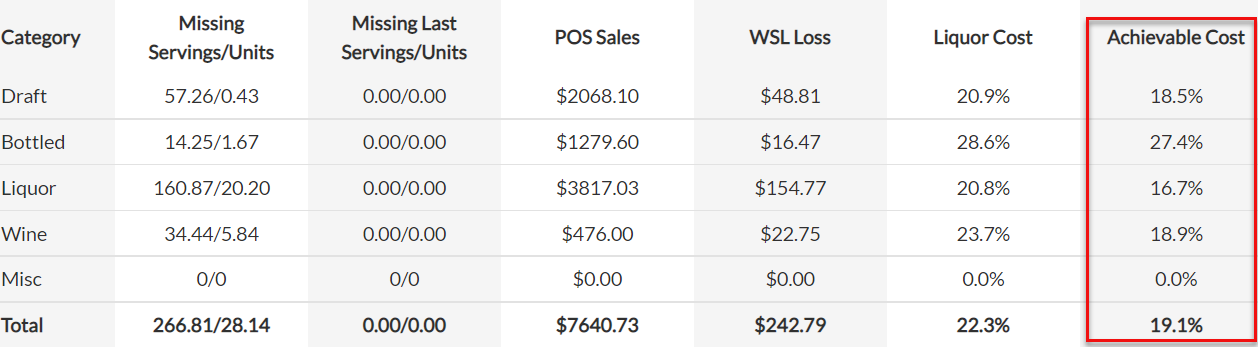
Achievable Liquor Cost
Achievable liquor cost tells you what your liquor cost would be if you sold 100% of the product poured. This figure gives you a real world number to aim for that isn’t based on industry standards. Instead, it’s based on the unique factors associated with your bar such as your:
- Purchase price for products
- Pricing decisions
- Product mix
- Discounts offered
- Shift drinks
- Taxes
It’s extremely informative to know what your real world best case liquor cost would be. It’s almost impossible to achieve this ideal figure, but when you have it as a goal, you’re able to make changes to your operations which can get you significantly closer to it than you currently are.
Handwritten Commentary and Recommendations
When you use the Pro version of our software, you’re paired with a dedicated success agent. This person is an independent expert with extensive experience performing bar inventory audits, and they can help ensure your results are accurate down to the serving. In addition, your success agent helps you identify and reconcile errors, and performs all number calculations and data processing for you.
After this process is complete, your success agent will present you with comments, feedback and recommendations for actions you should take to improve performance. These recommendations will all be data driven and guided by extensive experience performing inventory at bars of all types and sizes. There will be a dedicated section of your inventory report which provides this valuable commentary, allowing you to continue to improve your results with each audit.
To learn more about how Bar-i can streamline your processes and maximize your profitability, please contact us today to schedule a free consultation. We serve bars and restaurants nationwide from our offices in Denver, Colorado.

-1.png)