
There are several different goals that can be achieved from the bar inventory process. These range from surface level goals such as determining what you need to order to deeper level goals such as obtaining the data necessary to evaluate the performance of your bar.
When evaluating inventory systems, it’s important to understand the goals you would like to achieve from this process in order to ensure you choose the right system for your needs. Ultimately there are three levels of inventory. The first can be achieved in-house without the need for any software. The two deeper levels require either spreadsheets or dedicated software to deliver the results you are trying to achieve.
Level 1: Inventory for Ordering
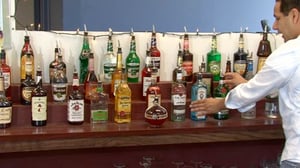
At its most basic level, taking inventory simply tells you how much product you have on-hand so that you can order the right amount to maintain a fully stocked bar. You need to replace what was used each week to avoid the awkward moment where your bartender has to tell a customer that you’re out of the drink they ordered. This first level of inventory lets you know what needs to be placed in your weekly orders.
This can be accomplished with a quick visual check of the inventory you have on-hand. Your bar manager can simply walk around to visually see how much product is behind the bar and in the storage room. Based on these values, you should be able to determine what needs to be ordered.
Work Smarter, Not Harder: Get Organized
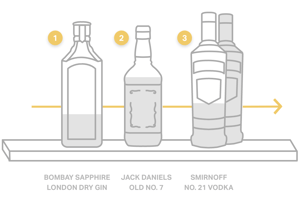
 If this is your primary goal for inventory, you will want to make sure your bar is well organized in order to make this process as efficient as possible. We recommend that every product has a fixed location and you only keep one bottle of each item behind the bar.
If your bar is organized this way, you don’t need to look at the open bottles. On average, every bottle will be about half full. Taking this approach allows you to focus your efforts on counting bottles in the storage areas.
To make counting the storage area go smoothly and efficiently, we recommend the following process:
- Map out the storage area so that there’s a specific position where every product is always kept
- Set pars for each product
- Scan the area where each product is kept and compare the number of bottles on-hand to the par for that product
- Order the number of bottles necessary to reach the par for that product
There are several advantages to sticking to this surface level of bar inventory:
- Quick
- Easy
- Inexpensive
- You won’t run out of product
However, there’s a huge missed opportunity with level 1 inventory. You’re not recording anything with any level of detail or accuracy; you’re simply scanning the bottles in your storage room. As a result, you’re not getting any metrics that will tell you how well your bar is performing or data that will help you make the changes necessary to improve your bar’s profitability.
Level 2: Inventory for Liquor Cost
Liquor cost is an important metric that can be used to evaluate your bar’s performance at a base level. It tells you how many cents you spend purchasing a product for every dollar of sales. For example, if you have a 20% liquor cost, it means that for every dollar of sales you get, on average you spent 20 cents purchasing the product. While liquor cost can be calculated for each product served at your bar, most often level 2 inventory involves calculating liquor cost at the category level. In other words, you’d end up calculating individual liquor costs for each of the following:
- All draft beer products served at your bar
- All bottled beer products served at your bar
- All liquor products sold at your bar
- All wine products sold at your bar
The typical process for performing level 2 inventory counts involves:
 Tenthing method of counting – Your bar manager will move sequentially through the bar and starting with the partial bottles, estimate how full they are using tenths as your standard unit of measurement.
 - Record this value on a clipboard, spreadsheet, or app-based software – For example, if the bottle of Jack Daniels behind the bar looks like it is about 60% full, it would be recorded as .6 on the spreadsheet.
- Repeat the process with all full bottles – Once you’ve counted the partial bottles, your bar manager will go to the storage room and record the total number of full bottles for each product you carry.
Math Class: Calculating Your Liquor Cost Based on Your Inventory Counts
Most app-based inventory software will take the step of calculating your liquor cost for you. However, if you’re still using a clipboard and manually recording these inventory counts onto a spreadsheet, your bar manager will need to flex some math muscles to determine your liquor cost.
You start by using these aggregated counts (the total value of the full bottles plus the partial bottles) to determine how many dollars of inventory you have on-hand. For example, if you have 6.5 bottles of Jack Daniels and each bottle cost $20, then you have $130 of Jack Daniels on-hand.
 You’ll then need to factor in purchases and sales to calculate your liquor cost:
- Take the difference between the dollar value of the inventory at the start of the period and at the end of the period for each category (draft beer, bottled beer, liquor, wine)
- Add in purchase values for each product category to determine how many dollars of inventory you used during the period
- Run a POS report to determine the total sales for each product category during the inventory period
- For each product category, divide the dollar value of total product used by the dollar value of what was sold to determine the liquor cost for that category
The primary advantage of level 2 inventory is that it provides you with an objective metric of liquor cost. Usually this figure is broken down by category. You can then roll these four liquor cost figures together to determine the overall liquor cost of your bar. Level 2 inventory gives you the ability to track the changes in your overall liquor cost over time to see whether your bar is doing better or worse than in previous inventory cycles.
However, there is also a major drawback to stopping at level 2 inventory. This process lacks the granular data necessary to see where you should be. To illustrate this point, let’s look at the liquor category. On one end of the spectrum, you have well drinks which typically have a very low liquor cost. On the other end of the spectrum, you have premium products which tend to have a much higher liquor cost.
When you collapse 100 or more different products into a single liquor cost, you’re losing granularity. There are infinite combinations of usage that can potentially result in that category-level liquor cost:
- One week, you may sell a lot of well drinks which will result in a lower liquor cost
- The next week, you may sell a lot of Grey Goose and Patron, which will result in a higher liquor cost for the period
Because you don’t see the details regarding how much in the way of well vs. premium products were sold during each period, you can’t tell whether the change in liquor cost is due to declining performance or due to a change in the product mix being sold.
Avoid the Pitfalls of Comparing your Liquor Cost to an Industry Standard
 It’s common for bars to try and compare their liquor cost to an industry standard in order to determine how well they are performing. At Bar-i, we strongly recommend against taking this approach. We have clients in 22 states, providing us with a rather large sample size containing a variety of demographic factors. Some of our very successful clients have an overall liquor cost as low as 13%. In contrast, other equally successful clients running fast-casual or price-sensitive establishments are running liquor costs in the low 30s.
The point we’re trying to make with that illustration is that there’s really no such thing as an average or standard bar, and therefore it’s impossible to identify a standard liquor cost value that would identify your bar as performing well.
All bars have a unique business model and are impacted by factors that are specific to their business. These factors make it impossible to compare your liquor cost with other bars that have a different concept, are located in a different region of the country, or have a variety of other differences in the way they run their business.
Instead, we encourage you to develop a more advanced metric system that will help you determine what’s optimal for your bar rather than just comparing your data to an arbitrary average. In order to accomplish this, you need to utilize level 3 inventory.
Level 3: Product-Level Inventory Reporting
Level 3 inventory is the basis of the service provided by Bar-i. For every single product at your bar, we calculate the usage of that product down to the ounce and then compare it to what was sold. You can use this data to make changes at your bar which will result in a higher percentage of product poured being rung into your POS and sold to customers.
Achieving product-level inventory data is accomplished by the following process:
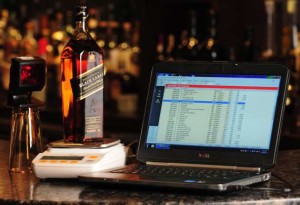 Count all products individually – We recommend using scales since they are much more accurate than tenthing. If you’re tenthing your liquor bottles, 1/10 of a 34 oz. (1 liter) liquor bottle is 3.4 oz. If that’s the smallest inventory increment you’re measuring and you’re selling these products in 1.5 oz. increments, there is a poor match between your measurement system and what’s happening in real life.
This variability in measurements becomes especially crucial when you’re evaluating high-end products where consistently overpouring by a few tenths of an ounce will make a big difference to your bottom line. If you don’t have a measurement system that can accurately calculate whether your bartenders are pouring 1.5 oz., 1.7 oz., or 2.0 oz. of a high-end liquor, you won’t be able to tell how well these products are actually performing.
Bar-i’s scales are accurate to the hundredth of an once, providing the accuracy you need to see whether these drinks are being poured properly.- Reconcile deliveries at the product level – In addition to thinking about the total amount of money you spent purchasing liquor products for a given period, you need to shift your thinking to evaluate how many ounces of each individual product were delivered during that inventory period.
This is accomplished by entering invoices line by line. When you use Bar-i’s software, you can simply scan your invoices into the system and our team handles all of the manual data entry for you. - Evaluate sales at the product level – Extracting sales at the product level is slightly more challenging than reconciling deliveries. At Bar-i, we pull out an itemized product mix from your POS system. Currently, we integrate with over 30 of the most common POS systems in use, and we’ve never failed to integrate with a POS used by one of our clients.
This process also requires us to write a recipe for every drink button programmed into your POS. These recipes allow us to determine how many ounces of each product should’ve been poured based on what was rung into your POS. We then compare this figure to what was actually poured (based on inventory counts) to see how much of each individual product is missing.
In order to achieve this product-level sales data, it’s crucial that you program your POS system in a way that ensures every drink served at your bar has its own button.
The primary advantage of level 3 inventory is that it allows you to compare what was sold vs. what was used in real life. This process will help you calculate your “achievable liquor cost” (what your liquor cost would be if every drink was poured correctly and rung into the system). Achievable liquor cost gives you a target to shoot for and a comparison to what your costs actually are for each product served at your bar.
The only potential downsides to level 3 inventory involve the complexity and cost of the process. However, these costs are negligible when you consider the ROI you achieve:
- Bar-i handles all of the complex aspects of the process for you. We write all the recipes for your POS buttons, do all the number crunching, create all the reports, and provide you with easy-to-understand explanations and recommendations.
- On average, most Bar-i clients improve their liquor cost by three full percentage points or more once they’ve made the changes to their operations we recommend based on their inventory data. For a mid-size bar generating approximately $40,000 in sales per month, this would equate to an additional $1200 in profits each month. The cost of Bar-i’s service is $320 per month for most bars. This is a modest expenditure to reap an extra $1200 in profits. You don’t need to be a math nerd to figure out you’re getting much more in return than you’re spending on the process.
Important Considerations with Level 3 Inventory
Accuracy is critical when you are dealing with level 3 inventory data. If you’re serving alcohol in 1.5 oz. increments, you need a counting method which is accurate enough to give you data down to the serving. This is why we use scales that are accurate to the hundredth of an ounce. It provides you with the fastest, most accurate and most effective method of counting inventory.
You will also need to build an error-checking system into your inventory efforts. When you’re receiving this level of detail from your inventory data, errors become glaring. If you’re only doing level 2 liquor cost inventory and you miscount a bottle of liquor, that $20 bottle is going to have a negligible impact on your overall liquor cost. However, when you’re doing level 3 product-by-product inventory, miscounting a full bottle is going to significantly impact your data.
For example, if you are expecting that you sold 20 shots of Jack Daniels and your inventory count says you’ve poured 44 shots (because you counted incorrectly), then that will register as a lot of missing product when in fact it was just a counting error.
To avoid this issue, you need to have an error-checking stage when performing level 3 inventory. At Bar-i, we’ll identify these potential errors for you and itemize them in a variance report so that you can go back and double check to make sure these items were counted properly.
Level 3 Inventory is the Best Way to Reduce Shrinkage and Lower Your Liquor Cost
One of the realities of the bar industry is that there are strong incentives working against your ability to maximize profits. Most bartenders will receive better tips if they pour heavy and give away drinks, creating powerful financial incentives for them to do so in certain situations. This is one of the primary reasons why 15-20% inventory shrinkage is the industry standard. The only way to address this problem is to get detailed performance data for each individual product you serve at your bar and use this information to make changes that will improve poorly performing products.
If you’d like to learn more about how Bar-i can help you streamline your operations and maximize profits, please contact us today to schedule a free consultation. We serve clients nationwide from our offices in Denver, Colorado.

-1.png)